In their article “Multimodal analysis of ocular inflammation using the endotoxin-induced uveitis mouse model,” Chu et al used images captured with the Phoenix OCT of the retina and anterior segment to correlate infiltrate level with neutrophil count during uveitis. To develop objective multimodal methods of analyzing infected eyes, they also examined flow cytometry of infiltrates, protein analysis of ocular supernatants, and qPCR of remnant tissues.
To induce uveitis, Chu et al injected lipopolysaccharide (LPS) into the vitreous of mice. LPS is a TLR-4 agonist and is used to induce uveitis to study central nervous system and ocular inflammation. LPS is cost effective, quickly causes uveitis, and the pathology stays within the eye. LPS-induced uveitis emulates anterior chamber disease models but can also be used as a model for many inflammatory eye diseases.
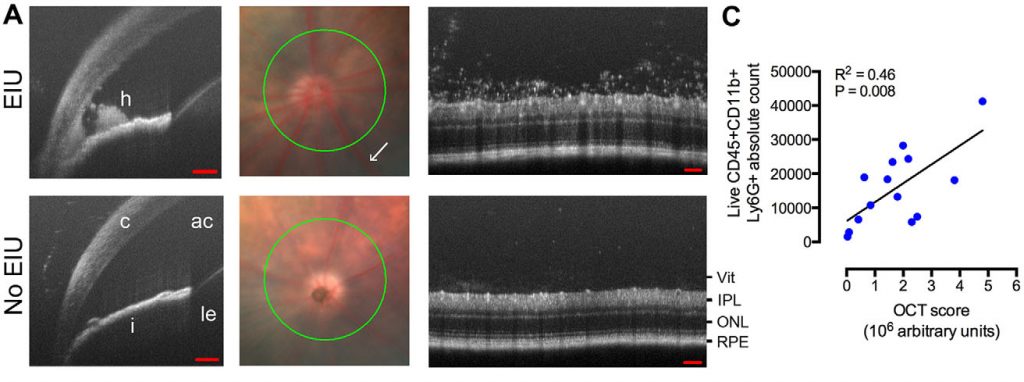
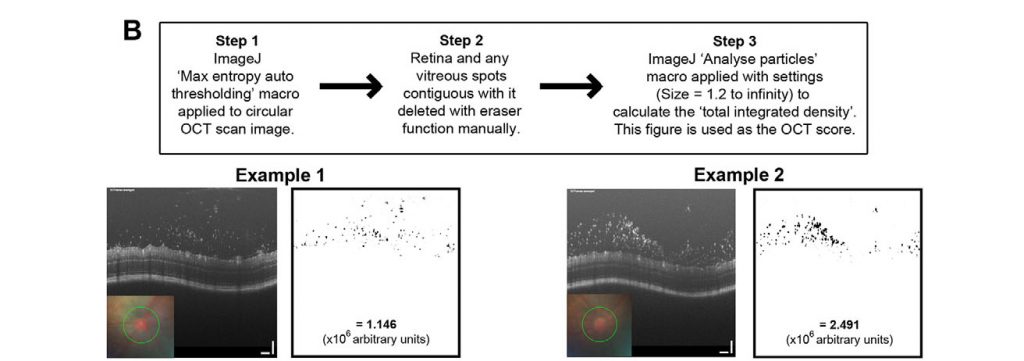
Chu et al performed their multimodal analysis of this uveitis model because the previous methods of analysis were manual, subjective, and on paraffin sections. They improved upon these analyses by examining flow-cytometry results, protein analysis, and qPCR. They also used the Phoenix OCT to examine live, real-time images of the infiltrates in both the anterior chamber and retina. The crisp, high resolution images clearly show infiltrates appearing as clumpy material in the irido-cornea angle and around the optic disc in the retina of infected mice (Fig 1A), starkly contrasting with non-infected mice, who had normal, clear anterior chambers and retinas. Using ImageJ manipulation described in Figure 2, Chu et al were able to assign an “OCT score” to the images objectively rating the amount of visual infiltrates in the retina. This score significantly positively correlated with the neutrophil count as measured by flow cytometry (Figure 1C). Not only do the OCT images provide a striking visualization of the infection in real-time in live mice, they also provide a way to quantitatively rate the infection level.
In summary, Chu et al have provided a multimodal method of analyzing LPS-induced uveitis using ex-vivo eyes and in-vivo imaging.