Using the Phoenix retinal imaging and functional measurement to study retinal ganglion cell survival during chronic (glaucoma) and acute (optic nerve crush) injury
Liu et al studied the survival and dysfunction of retinal ganglion cells (RGC) during chronic (glaucoma) and acute (optic nerve crush) injury in a series of comprehensive and elegant articles published from 2015 to 2017. The researchers used the Phoenix ERG and Micron IV provide a complete picture of RGC disruption.
In their 2015 article, “Progressive Degeneration of Retinal and Superior Collicular Functions in Mice With Sustained Ocular Hypertension,” published in IOVS, ocular hypertension was induced by laser shots to the corneal limbus combined with microbead injection, which led to a sustained increase in intraocular pressure. As expected, OCT images showed the nerve fiber layer + ganglion cell layer thickness was reduced and immunohistochemistry confirmed less dense RGCs in the hypertensive eyes.
Using a Phoenix full field ERG Ganzfeld system, Liu et al found clear indication of RGC dysfunction. Oscillatory potentials were decreased as soon as four weeks post hypertension-induction and continued to degrade as time passed (Fig 1M). The a and b waves were unaffected until 11-14 weeks post hypertenstion-induction, when they were significantly reduced (Fig 1K-L). Ex-vivo multi-electrode array revealed that the receptive field of ON and OFF RGC but not ON-OFF RGC decreased after chronic hypertension.
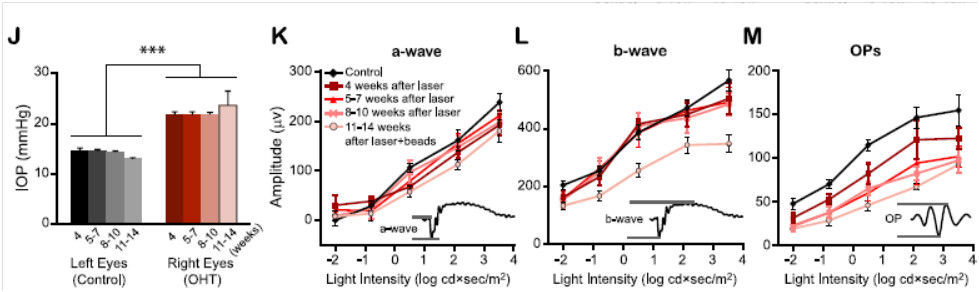
Figure 1 (2 J-M in article): J) Demonstration of sustained increased intraocular pressure in eyes treated with laser shots and microbead injection. K) Phoenix ERG revealed decreased a-wave amplitude after 11-14 weeks of ocular hypertension. L) Similarly, the b-wave decreased in amplitude after 11-14 weeks of ocular hypertension. M) The oscillatory potentials showed earlier dysfunction starting at 4 weeks after induction of ocular hypertension.
They also published a short review in 2015 in the Journal of Nature and Science, “Subtype-dependent Morphological and Functional Degeneration of Retinal Ganglion Cells in Mouse Models of Experimental Glaucoma” which compares the work of three laboratories on RGC degeneration during glaucoma.
The 2016 article “Retinal Ganglion Cell Loss is Delayed Following Optic Nerve Crush in NLRP3 Knockout Mice” explored RGC survival after optic nerve crush in wild type and NLRP3 knockout mice. The NLRP3 inflammasome is a sensor for pathogen-and host-derived threats and induces neuroinflammation and is upregulated after optic nerve crush. With the Micron retinal imaging camera, Puyang et al examined the in-vivo longitudinal survival of RGC using transgenic mice. Thy-1-YFP mice have YFP-labeled RGC, which were combined with NLRP3 knockout mice to create two groups: normal NLRP3 mice with YFP-labeled RGC and NLRP3 knockout mice with YFP-labled RGC. RGC are clearly visible in the retinas of Thy-1-YFP mice with the Micron camera and produce stunning images (Fig 2A, B)
In the normal level of NLRP3 mice, RGC numbers steadily decreased in the weeks after optic nerve crush injury, from 78% 3 days post injury to 13% survival 4 weeks afterwards (Fig 2C, E). Heterozygous NLRP3 mice showed a similar trend (Fig 2C, E). In contrast, the NLRP3 mice had many more surviving RGC, from 89% 3 days after injury to 25% 4 weeks afterward (Fig 2C, E).
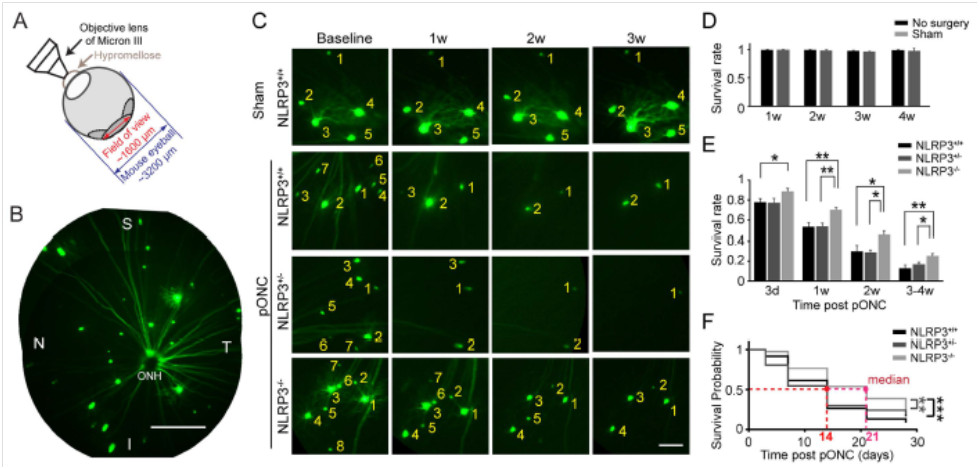
Figure 2 (Figure 3 in the article): A) Demonstration of Micron imaging technique). B) RGC are stunningly visible in Thy-1-YFP mice using the Micron retinal imaging camera. C) RGC survival was increased with decreased levels of NLRP3 in the mice. D) Sham crush had no effect on RGC levels. E) Quantification of Figure 2C. F) The probability of survival increased with decreasing levels of NLRP3.
Axon survival was also improved in the NLRP3 knockout mice as shown by Micron imaging of the YFP-tagged RCG. Both the central and peripheral retina was able to be imaged (Fig 3A) and the in-vivo Micron-demonstrated level of axon loss correlated well with ex-vivo confocal imaging (Fig 3B, C). Axon counts were significantly higher in NLRP3 knockout mice (Fig 3D), and axon counts in the central and peripheral retina were not significantly different (Fig 3E, F). Together, the data demonstrate that reducing neuroinflammation by knocking out the NLRP3 gene delayed RGC loss after optic nerve crush injury.
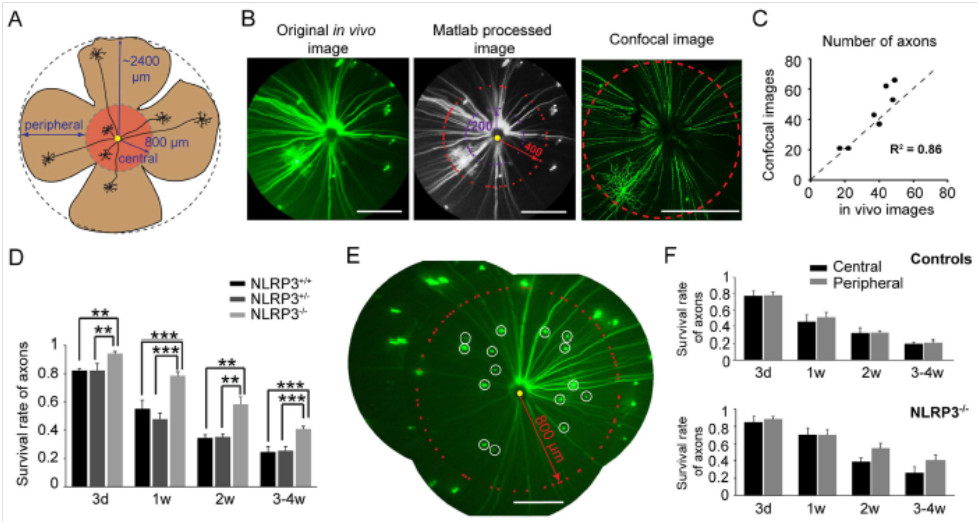
Figure 3 (Figure 4 in article) A) Imaging of peripheral and central retina. B, C) Correlation of in-vivo Micron images and ex-vivo confocal images. D) NLRP3 knockout mice had better axon survival. E) Representative image. F) Central and peripheral axon levels were not significantly different.
Finally, in their 2016 article “Overexpression of Brain-Derived Neurotrophic Factor Protects Large Retinal Ganglion Cells After Optic Nerve Crush in Mice,” Feng et al explored the effects of brain-derived neurotrophic factor (BDNF) on large-soma RGC survival after optic crush. BDNF is a nuerotrophin essential for neuron survival and function. The Thy-1-YFP mice with YFP-tagged RGC were again used, with some receiving a cre-induced upregulation of BDNF. The Micron produced clear images of the mouse retinas with easily identifiable large-soma RGC (Fig 4D). They found that RGC survival was increased with upregulation of BDNF (Figure 5).
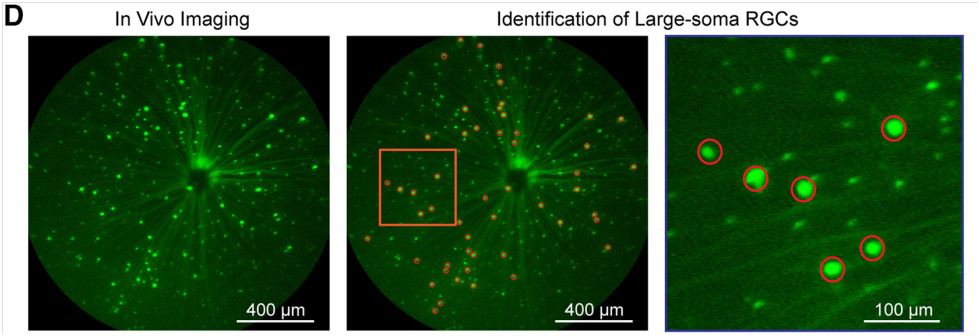
Figure 4 (Figure 1D in article). The Micron clearly shows different soma sizes of RGC.
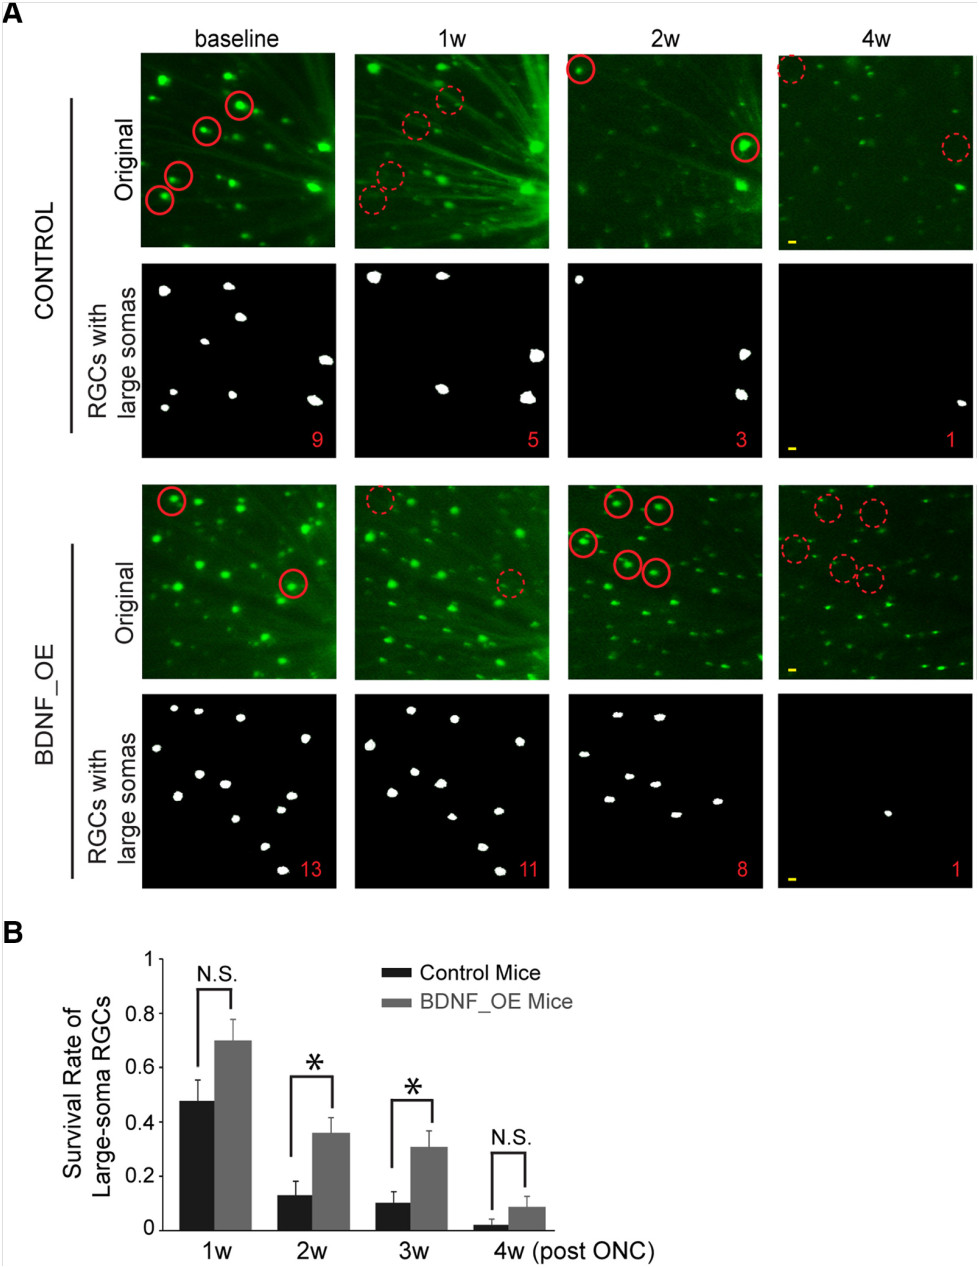
Figure 5 (Figure 3 in article). A) The micron shows better survival of large-soma RGC with upregulation of BDNF. B) Quantification of survival.
In summary, Liu et al have provided a comprehensive picture of RGC survival in various injury states. Their images and functional data elegantly use the Phoenix system to demonstrate RGC dysfunction in chronic and acute injury.


